Key findings
Frontier-scale vs. open models
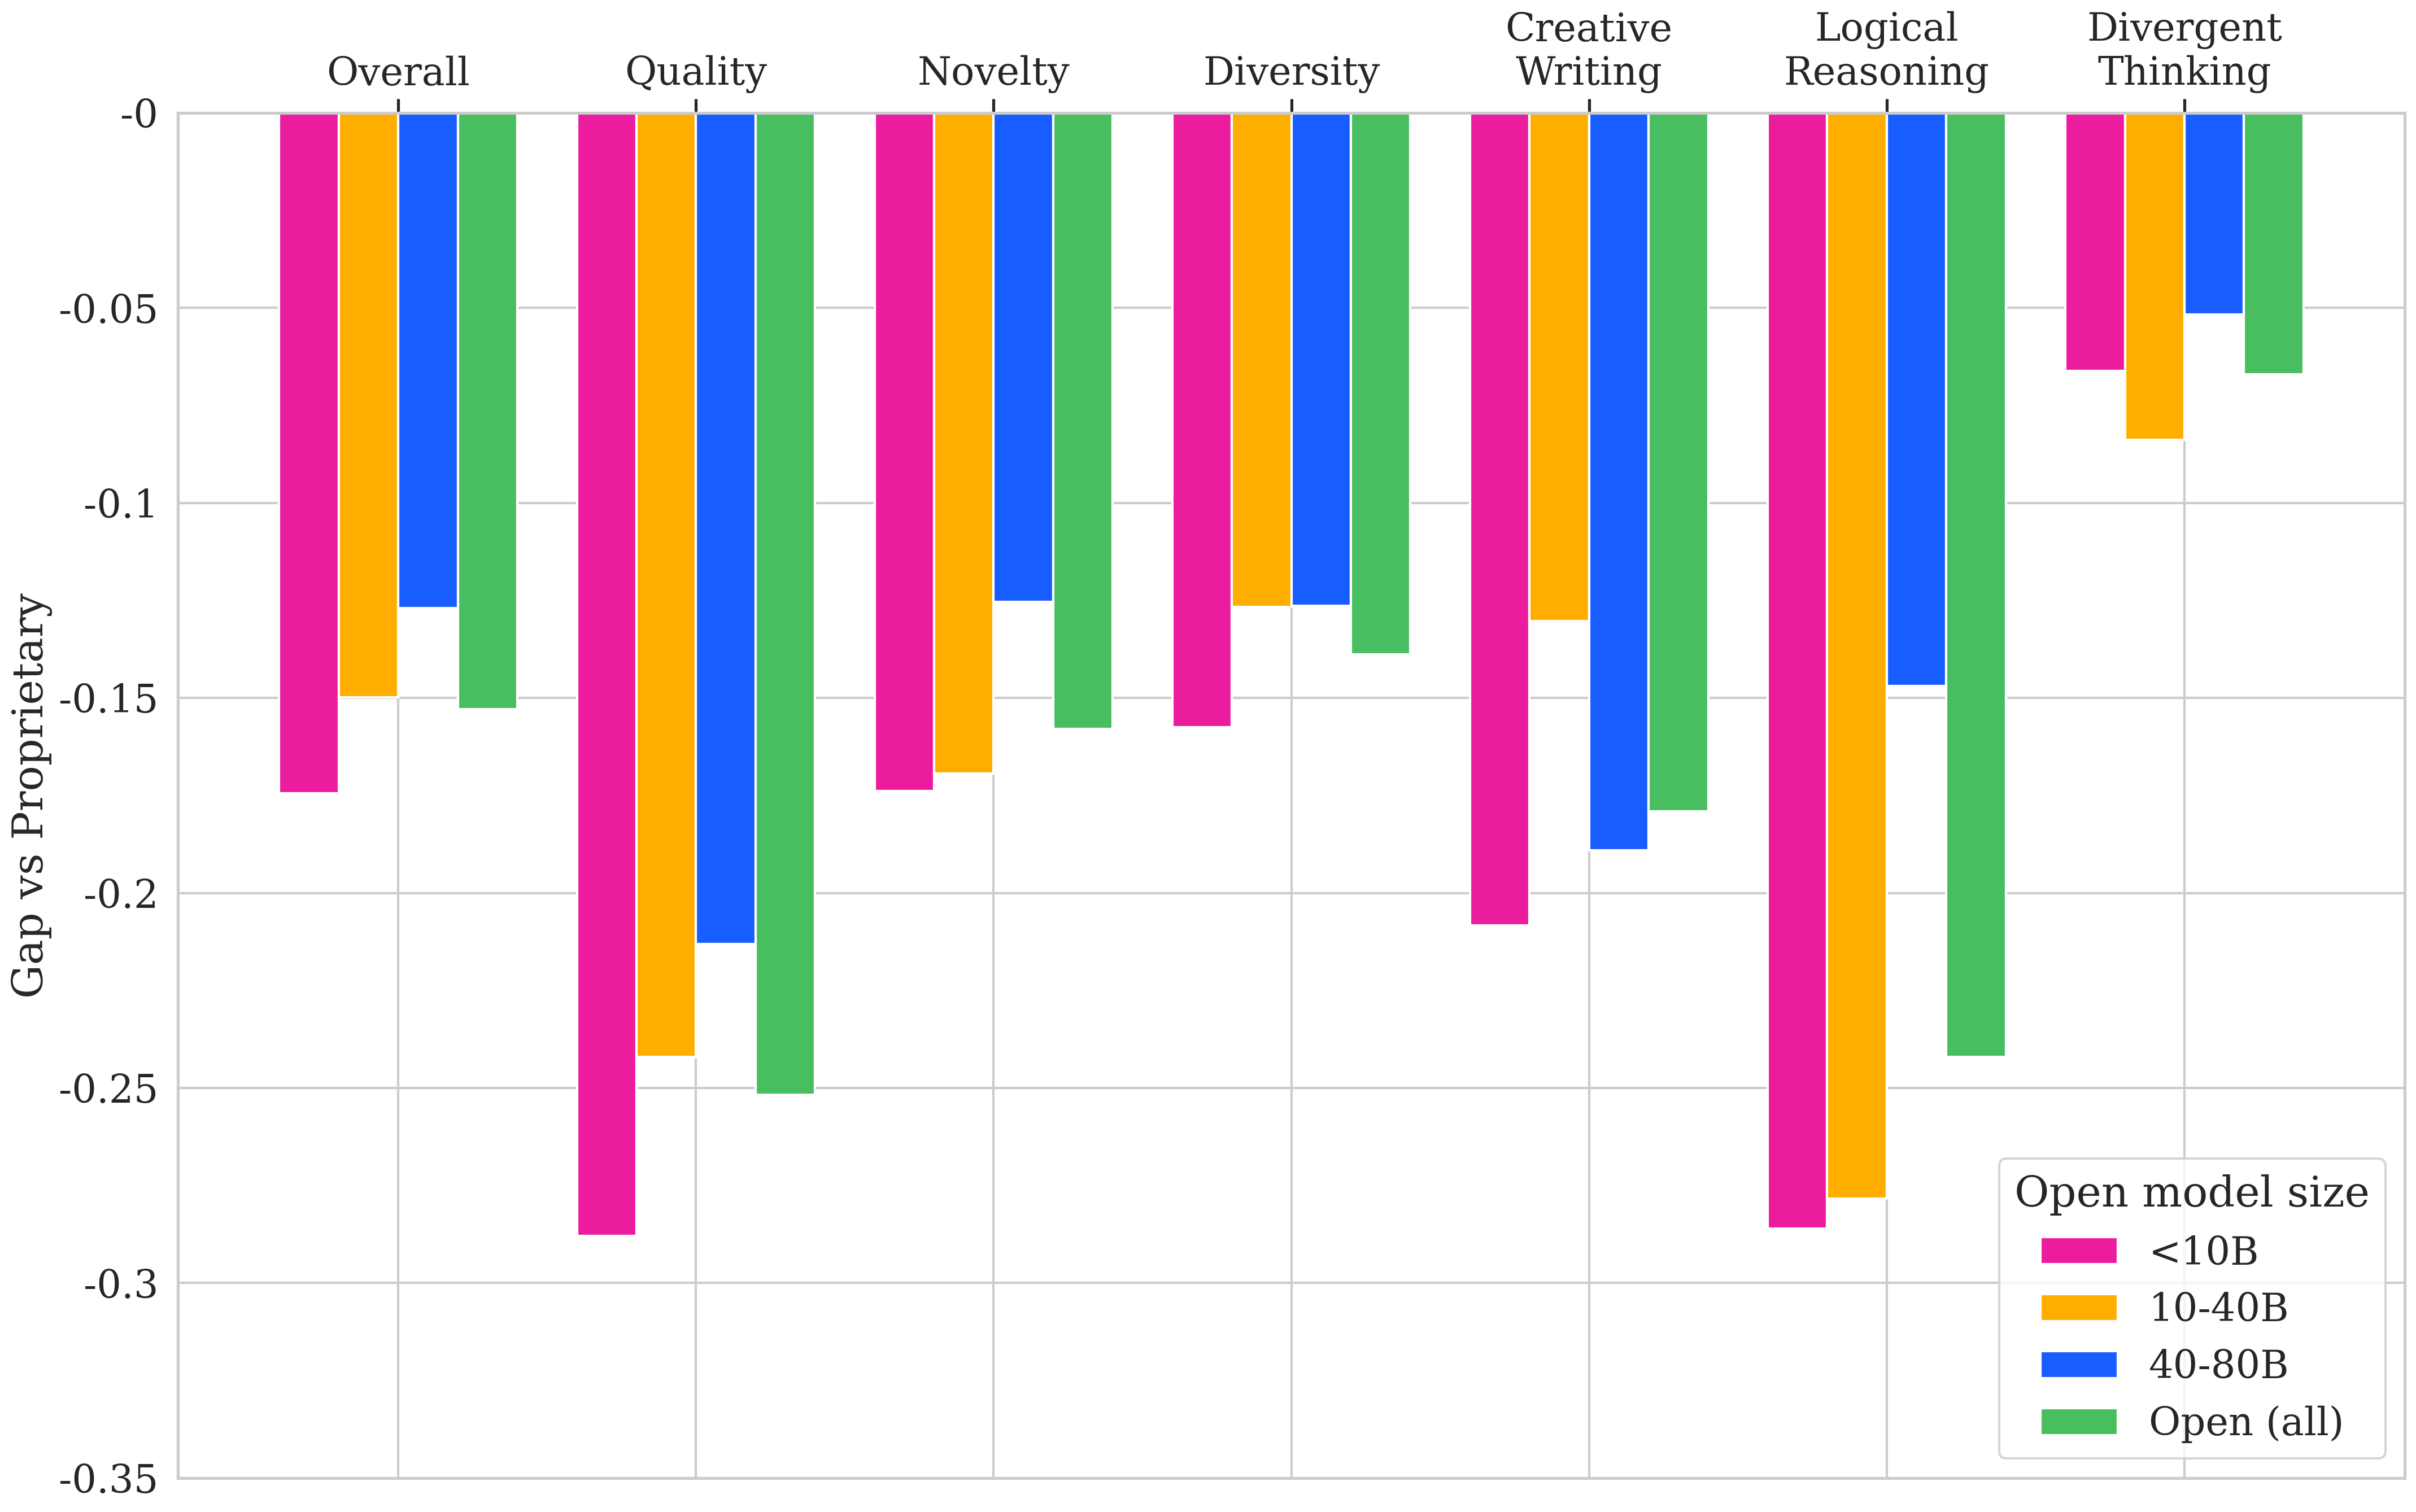
The best frontier-scale models beat the best open models by more than .10 (15%) in every dimension, as most people would expect; but where that gap comes from is the more interesting part:
- By domain. The gap is widest in logical reasoning and creative writing, and much narrower in divergent thinking. Coding and mathematical reasoning are in every frontier model's technical report; writing data shows up in most post-training mixes, while divergent thinking is in none of them.
- By dimension. Quality separates the two groups more than novelty or diversity do, consistent with the same explanation above, since quality carries the reasoning-heavy metrics (NeoCoder Convergence@0, Creative Math Correctness).
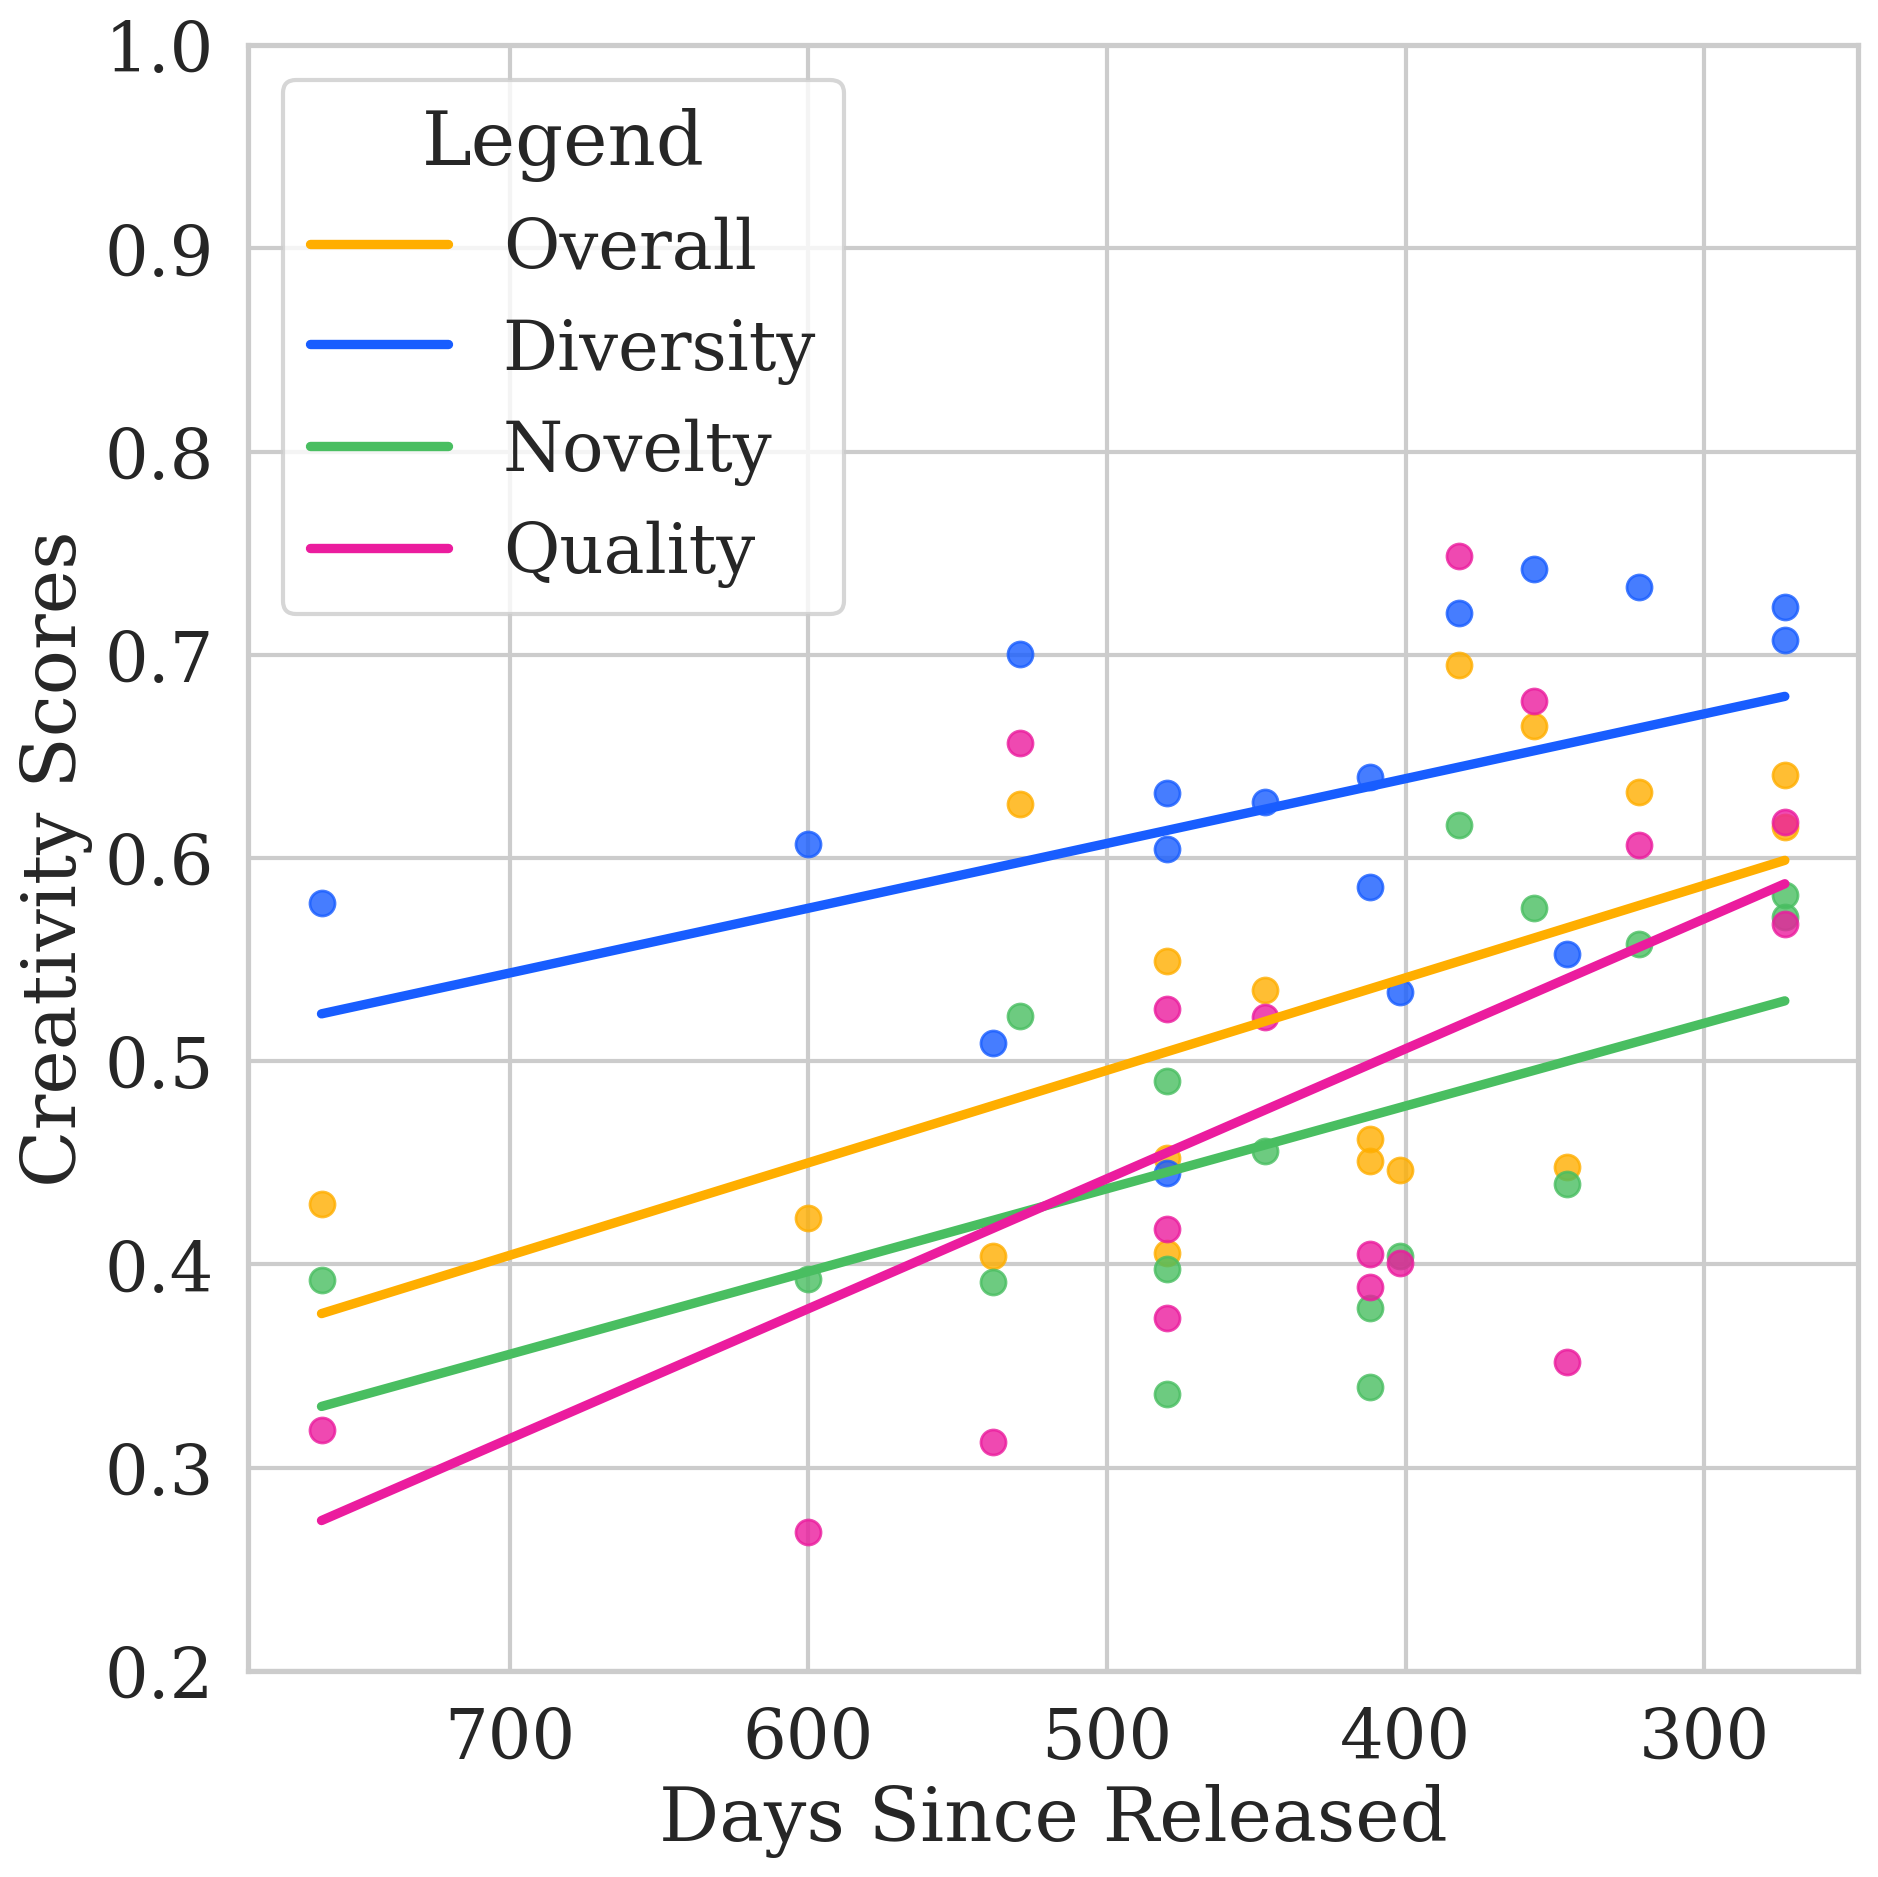
Time of Knowledge Cutoff
We have also found a performance improvement along the time axis: several of our metrics reward content that differs from what came before (L-Uniqueness in Creativity Index, Divergence@0 in NeoCoder), so a later training cutoff is itself an advantage.
Correlation across metrics
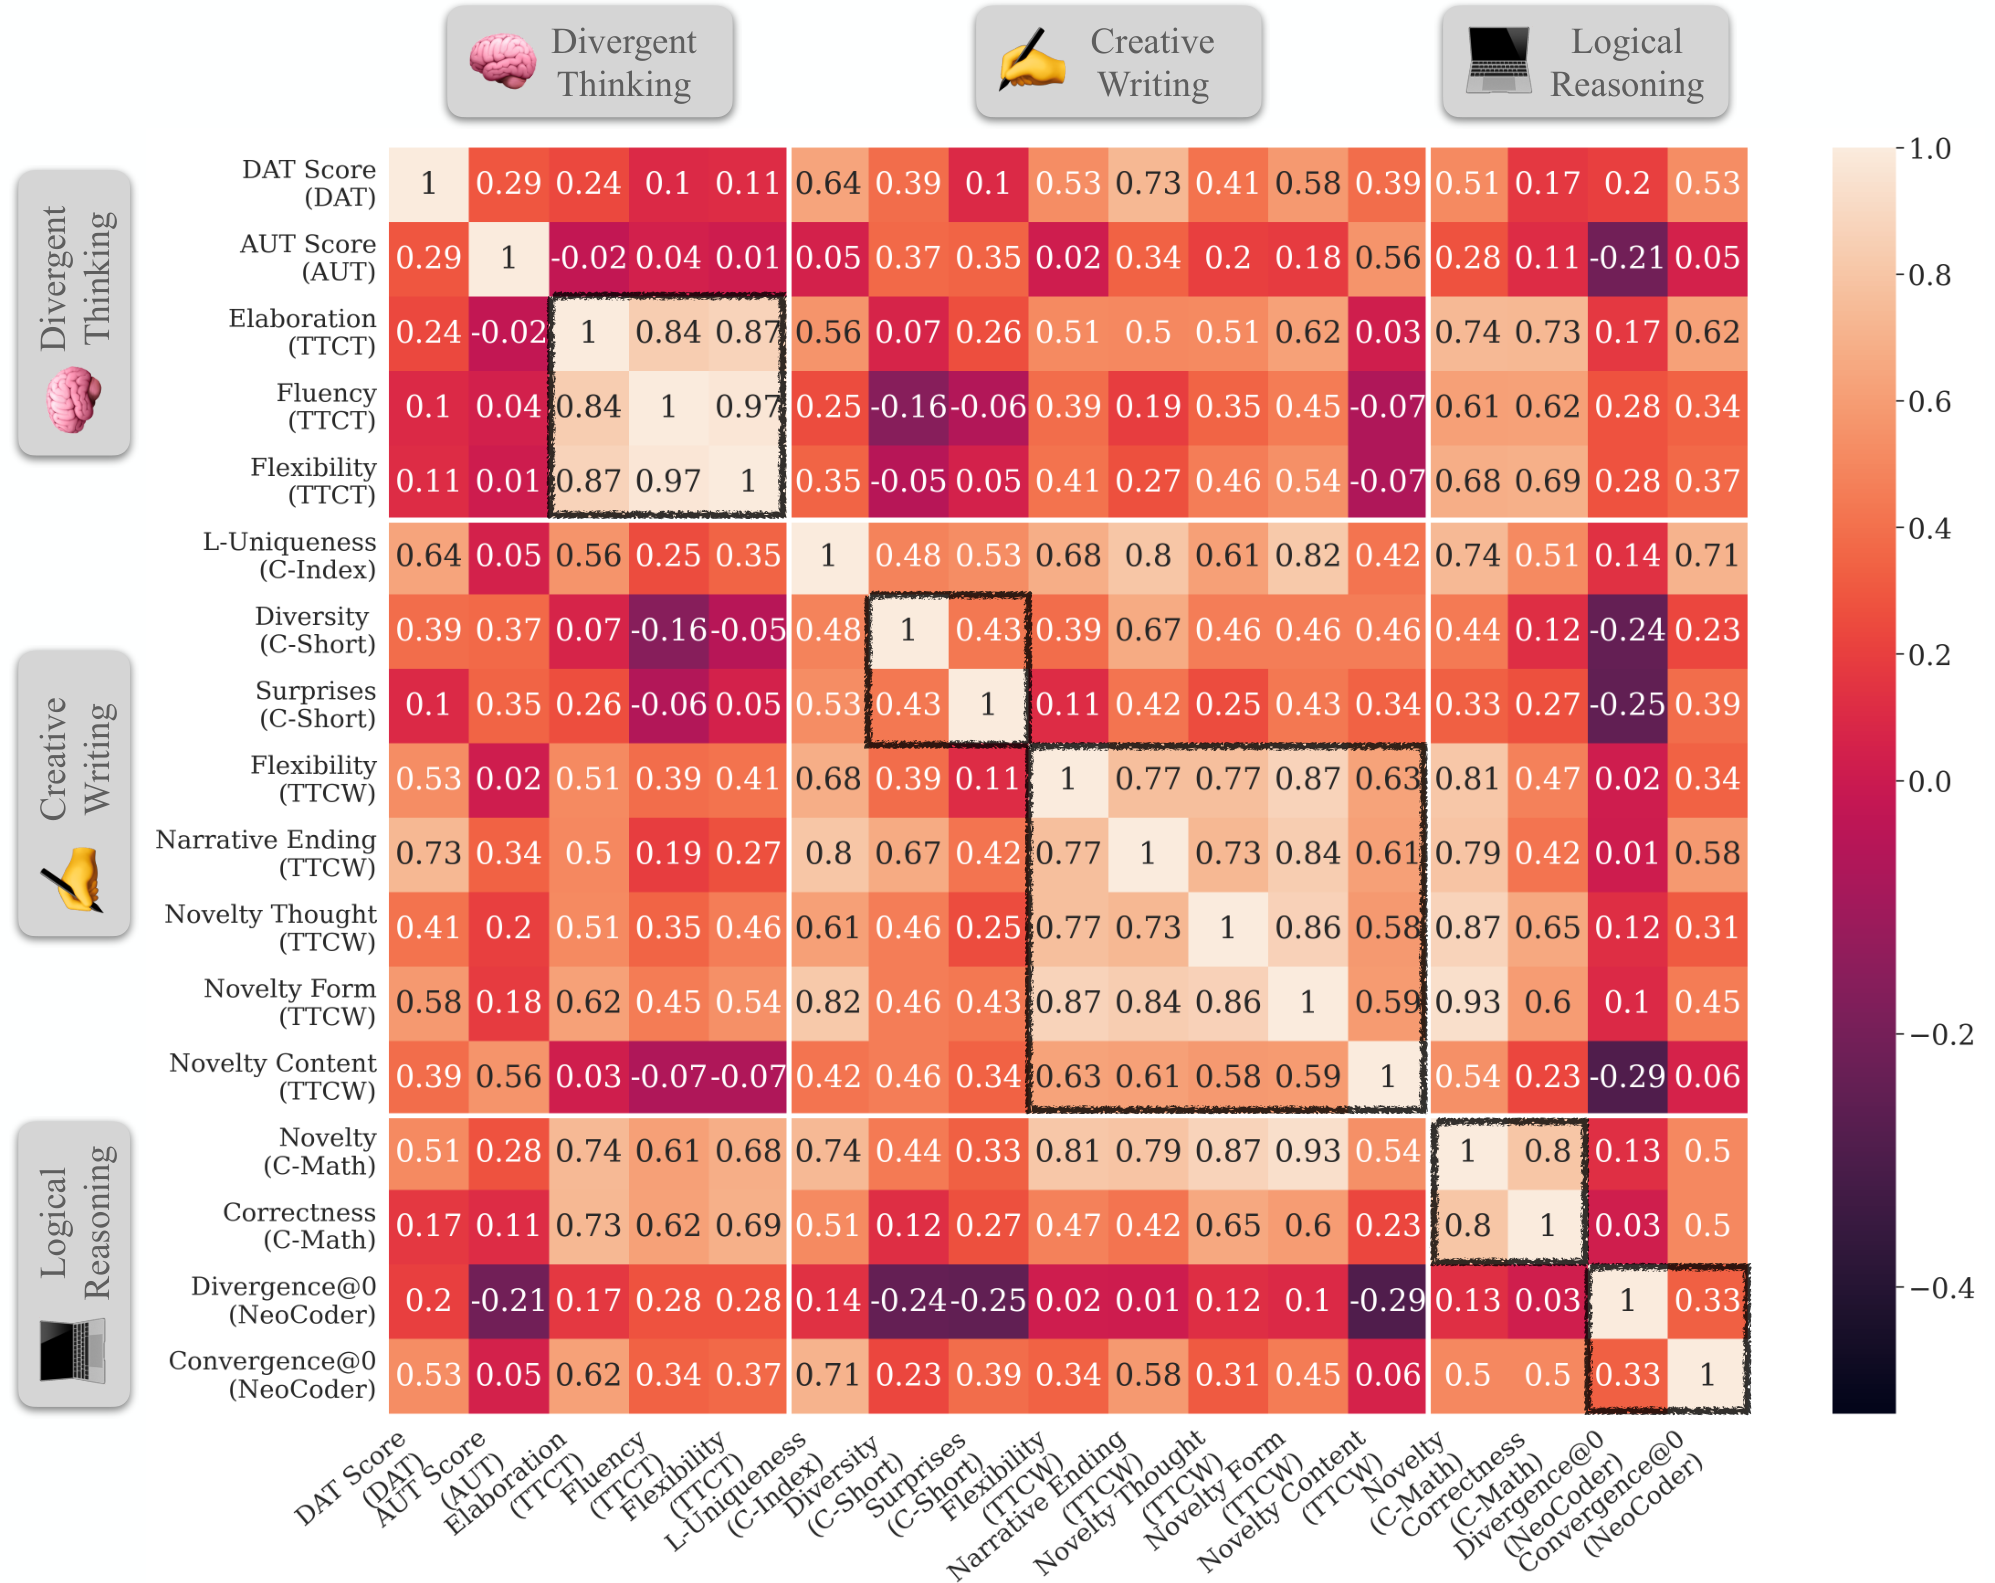
We correlated every model's performance across every pair of metrics (Pearson's r). The structure that comes out:
- Within a task, metrics agree. TTCT's internal metrics correlate at ≥0.84. Creative writing tasks also agree with each other, more than tasks in the other domains do.
- Within a dimension, it depends which dimension. Quality metrics highly correlate with each other, and so do diversity metrics, even across unrelated tasks. On the other hand, Novelty metrics do not correlate well with each other. They correlate weakly with each other, and sometimes negatively, e.g., Creative Short Story's Surprises and NeoCoder's Divergence@0 sit at -0.25.
- Across domains, little agreement. A model strong in one domain or dimension is not reliably strong in another.
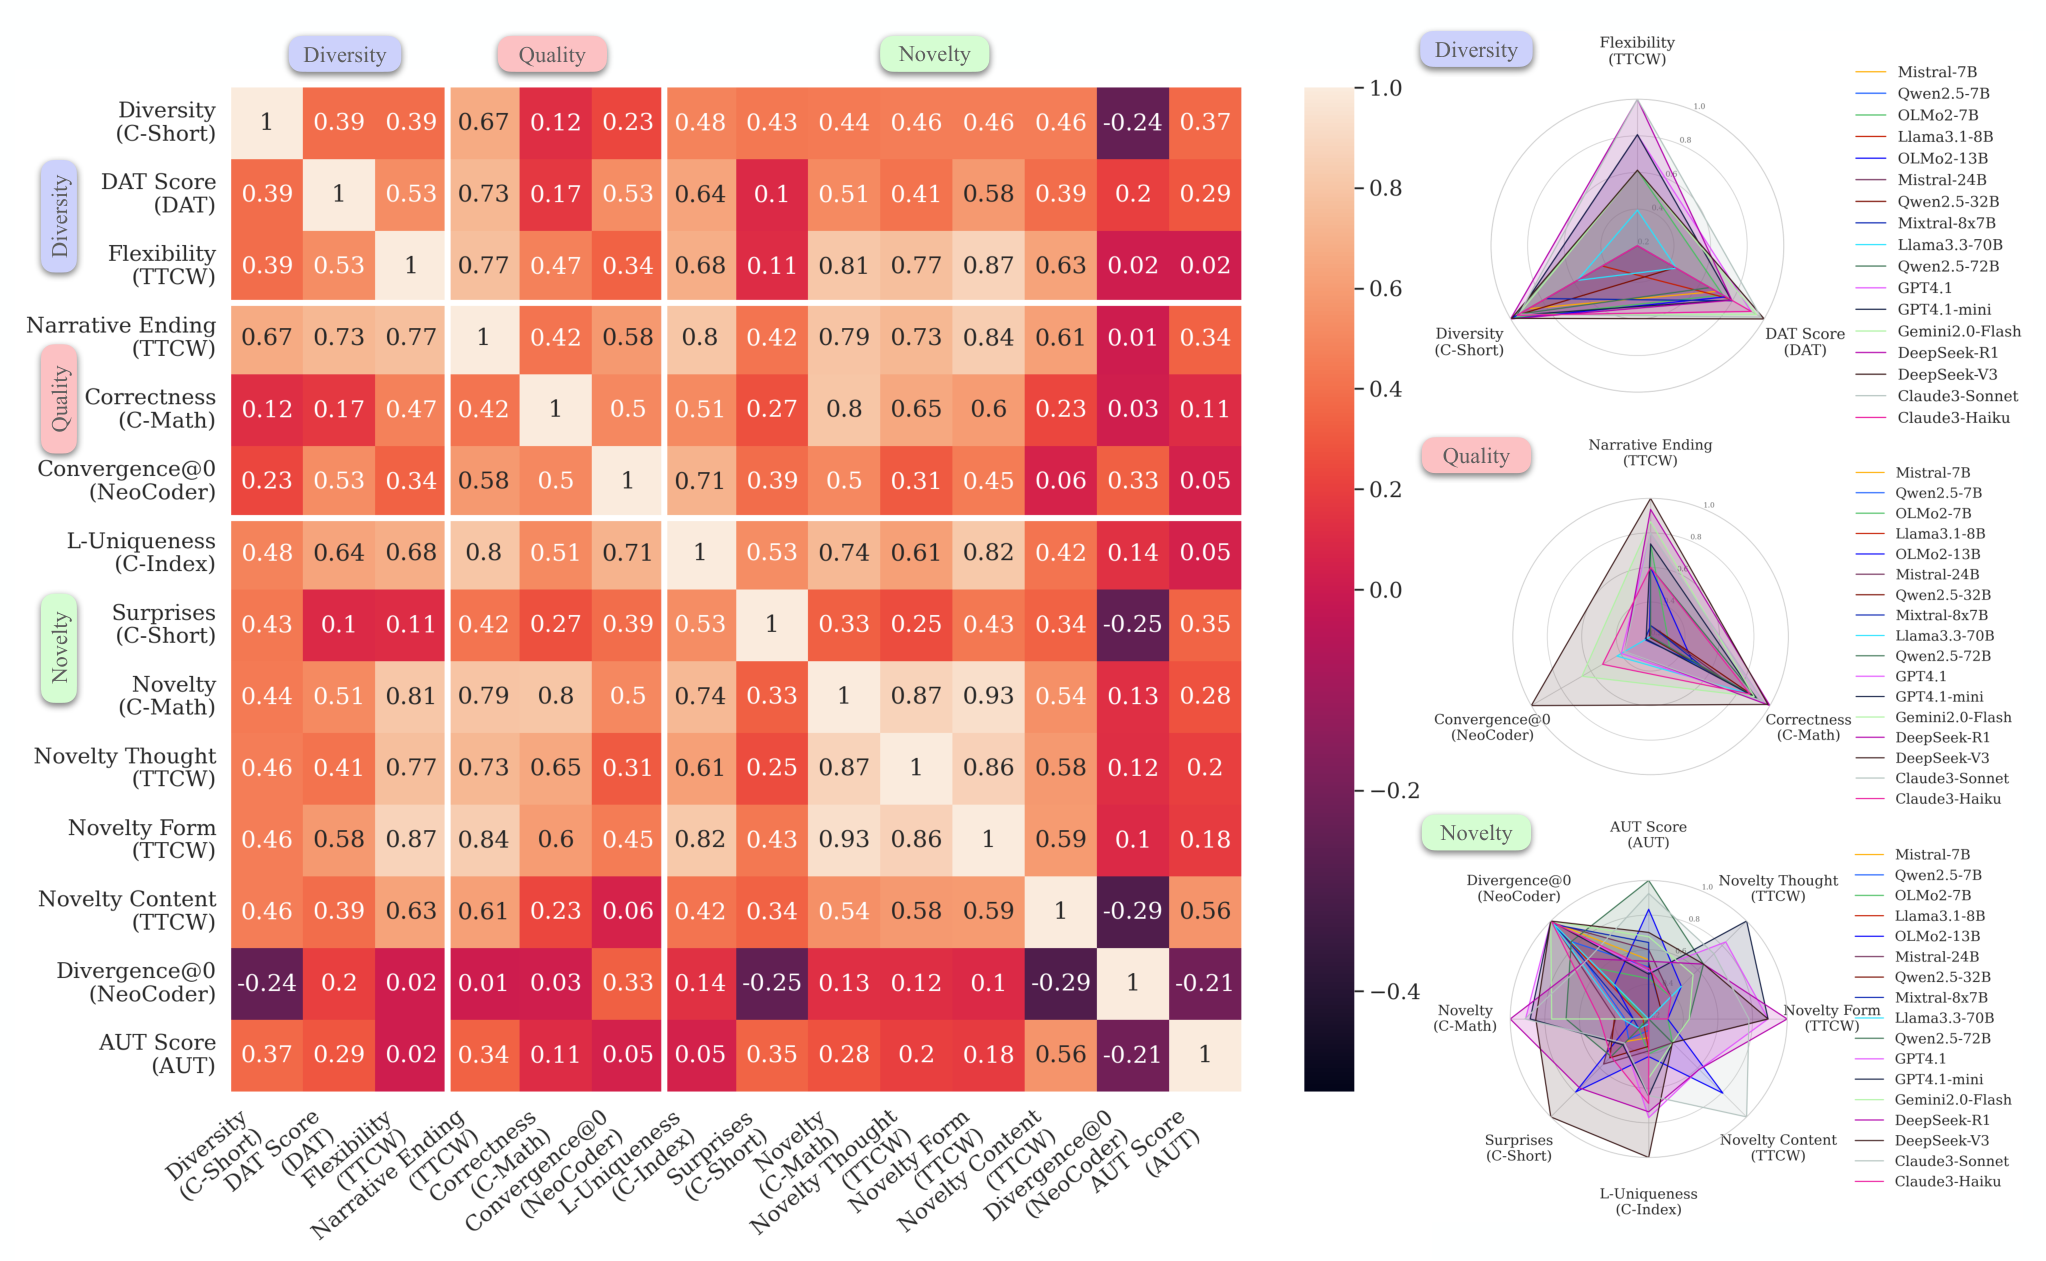
Why novelty behaves differently
Novelty is the only dimension that has to ask novel compared to what?, and each task answers differently: against a human-written corpus, against known human solutions, or against common conceptual associations. Quality asks whether an output is well-formed, which is intrinsic to it; diversity asks how much outputs differ from each other, which is measurable inside one model's own generations. Novelty always needs an outside reference, and those references are not the same thing.
This echoes our motivation: no single creativity metric stands in for the rest and performing well in one metric or one dimension does not guarantee good performance in another.